How Power Metering Empowers Toyota
By Kate Bachman | July 24, 2013
Category:Georgetown, Ky., just a horse’s trot north of Lexington, is horse country. Down nearly any country road, the land is crisscrossed with white horse-fenced bluegrass meadow after white horse-fenced bluegrass meadow. Many of the Kentucky Derby and Lexington Keeneland race horses are stabled here. The thunderous pounding of their hooves can almost be felt underfoot.
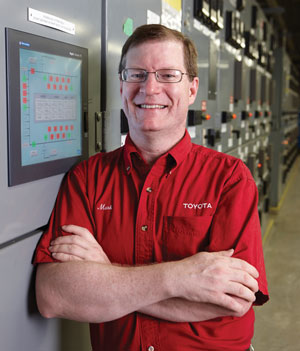
If you want to know just how much an automaker plant depends on its energy to function, just shut down the plant for a minute by shorting out a light fixture. Mark Rucker knows. Rucker oversees Toyota Motor Manufacturing Kentucky’s (TMMK) electrical systems.
“I actually shut the power off to the whole plant by changing out an LED light bulb. I have also tripped the plant power off by opening a door. That was in my second week here.”
Today, Rucker is a different kind of green, having led the team of electrical specialists who keep the multibuilding complex humming and maintain the plant’s extensive metering system. The knowledge gained from the data captured led to the changeout of old equipment with energy-efficient equipment and the streamlining of operations, which cut the energy consumption per vehicle in half.
Billboards for the famous horse race positioned along I-64 from Louisville to Lexington beckon, “Experience the most exciting two minutes of your life.”
The region also is home to Toyota Motor Manufacturing Kentucky Inc. (TMMK), which races the clock using a whole different kind of horsepower. In that same two minutes, the automaker can roll out four Camrys, Avalons, or Venzas—with seconds to spare (see Figure 1). Beginning in 2015, the automaker also will make the Lexus ES 350.
TMMK, one of 14 manufacturing plants in North America, is Toyota’s largest factory outside of Japan. The stamping, body weld, paint, powertrain, plastic molding, and assembly shops comprise nearly 7.5 million square feet and are housed on 1,300 acres.
The plant’s 6,600 employees manufacture 500,000 vehicles a year—roughly 2,000 vehicles per day in two production shifts per day, five days a week. Since start-up in 1988, the site has built more than 9 million vehicles (see Figure 2).
The Toyota Production System (TPS) is almost as legendary as the Derby. Other automakers and manufacturers of all breeds have, to some extent, modeled their production systems after it. The core of TPS is waste elimination, and a focal point of TMMK’s waste elimination plan is energy waste elimination.
So where is the starting line for an energy waste reduction initiative? A utility metering system, according to Mark Rucker, who heads up the automaker’s electrical systems.
And where does it lead? To the installation of energy-efficient equipment and streamlined operations.
The automaker’s energy reduction initiatives cut energy consumption per car nearly in half.
Here’s how one of the world’s most efficient manufacturers managed to measure, and metered to manage.
Energy Management
The complex’s 135-unit substations distribute 13.2 KV, Rucker said. Plant peak power is 85 MVA. “We reach that peak every day when it’s really hot and we’re running all of our utilities,” he said. “If we’re not at 85, we’re at 84.9, because making cars is a continuous process.”
Corralling energy needs like that requires a high-powered energy management system.
“Toyota sees energy as a controllable number,” Rucker said. “Globally, energy conservation is one of our environmental targets, and we want to be an environmentally friendly company,” Rucker said.
That meant controlling energy use better, Rucker said. “In the Facilities Group, our call to arms was to meet these environmental targets.”
Electricity use, which had peaked out at 120 MVA now peaks out at 85 MVA. “From our benchmark year—roughly 1996—to now, we’ve cut out half of the energy used to make a car at this plant,” Rucker said. Only about 10 percent of that is a result of production increases, he added. “More than 40 percent of that is because we cut out wasted energy.
“So we’re making more cars using less power.”
Power Metering: Measure, Manage
The automaker’s first step in reducing wasted energy was to set up a metering plan.
“Toyota is very big about eliminating waste. In order to do that you have to know where you’re wasting,” Rucker said.
“You can’t manage what you don’t measure*. So if you’re going to look for energy waste, you’ve got to measure it. And then when you make a change, you can measure the change.”
The team put meters on its mechanical system—the compressed air and water chillers and natural gas—and also on the electrical system. Where it is feasible, the team also meters each machine and compares their outputs.
“Like a lot of other things, once you have the metering in place, you’ve got to have the data collection system, the reporting tools, the reporting method, and be able to make automated decisions … it’s a system,” Rucker said. “But it starts with having the metering in place. You have to invest some serious capital into having a metering system.”
Rucker said the investment is worth it. “Honestly, when we began, we didn’t know what our payback was going to be. But now, I could sit down and show you a less-than-a-year’s payback on that metering system.”
Two systems read the electrical system, pull in the information, and database it.
“We use systems such as the Square D PowerLogic™ system and Honeywell EBI [Enterprise Building Integrator™], so we use their software to gather up that meter data and store it,” Rucker said. “So it goes out and it reads the data points through a long series of controllers. It’s truly an enterprise system with a series of controllers and distributed servers to make that efficient, because we’re monitoring 30,000 points every few seconds, and storing 4,000 of those points in a database.”
That is where data management is needed.
“We’re using a manufactured system, but we’ve got to program it, and configure it, which is a real task. For a lot of companies, that is where they fall down. They don’t put enough effort into configuration, which requires a deep understanding of your own stuff,” Rucker said. “Now with the utility systems, with the chillers and air compressors, we have live data. We have efficiency data. Now we can grab data to the millisecond.”
Ron Holbrook, a member of Rucker’s team, remarked, “That was the big gap for us before we installed these sophisticated metering systems. We could get monthly energy, gas, and water readings and break them down by shops somewhat, but it was always after the fact. With the technology we use now for the HVAC and electric systems, we could go in right now and tell somebody what happened last hour so they can address it.”
The team’s first attempts to reduce energy consumption were false starts, because the team was relying on all hand-read meters and there was no communication among the meters.
“We couldn’t measure with enough granularity to show the need, the effective change, and to make decisions,” Rucker said. “We just didn’t have the data to be successful.”
When Plant 2 was built, the team installed 350 meters with Square D PowerLogic. “And we have never regretted it,” Rucker said. “This level of metering is now the standard for all of our future plants.” He added, “We like it because it allows us to see what’s going on and helps us to make decisions about where we should spend money.”
The company spent $250,000 upgrading the power metering in Plant 1 and then tried again to manage energy, that time much more successfully.
“So today, it all talks. We have a meter on everything—every bus duct, every main panel board, every unit substation, every medium-voltage feeder cable, and on our incoming (utility) mains and substation mains. And every year we pick up a few more,” Rucker said. A total of 550 meters are installed on electrical systems alone, he added.
How the Meters Are Used
Most of the electrical meters just gather energy data and information on amps, volts, and power, Rucker said. “But select meters, usually our mains, are high-quality meters, like the PowerLogic meters that allow us to look at waveform problems, surges, dips, sags, missing phases, and so on—that provide power quality numbers, and they’re very useful as well.”
Rucker relayed the steps he and his team followed to use metering to launch an energy management plan.
1. Became Acquainted With Utility Data. The first step was to understand their utility bill and gather their data, Rucker said. “Because that’s where your charges come from. If you don’t have a good handle on the information you’re gathering from utility companies, it’ll be hard to understand anything deeper in your own system.” Most utility companies provide access to their websites and offer charts on their energy reads, but you should also learn about the supply piece, he said.
“Natural gas is not the same everywhere. It has different BTU content depending on where you are in the pipeline, and different pressures. Most industrial plants buy natural gas through a brokerage house or wholesale house. So that’s the procurement side, the contract side, and the quality side, but it’s also a management and a metering side.
“The people who are going to be making decisions about using and saving energy really ought to be seeing the bills.”
2. Assessed Consumption. The next step is to figure out what you need to know about how energy is consumed, Rucker said. “If natural gas only goes to one process, then you probably only need one set of meters to know what’s going on. In our case, natural gas is used by everybody. What does everybody need? And who is ‘everybody’?
And sideways from that, you have to understand your distribution system,” he said. “We know that the body weld shop is really hard to connect solid meters into, because they come from so many different sources. It would be cost-prohibitive to meter each machine to compare how much it outputs. But, the stamping shop is pretty easy. So if you know your distribution system and you know your needs and marry them, you can make priority decisions.”
3. Evaluated Data. Rucker and his team reviewed the data. “First we had to determine where the energy was being consumed, so we mapped all the shops.”
The data showed some surprises. “People look at our body weld plants and our robotic welding and see a lot of power being used. There is a lot of energy used in a weld, but only for really brief instances of time. Welding is only a couple of percentage points of our total energy demand,” Rucker said.
Then the team compared that usage to the paint process area and easily concluded that the paint operations consumed the most energy—electricity, natural gas, chilled water, and compressed air.
“You look at the paint process area and you see this long booth of cars going through it, and it looks like a little spray, and you think, ‘That doesn’t use much.’” Rucker said. “But they’ve got to filter the air and change the air over 50 times an hour and blow exactly the right air across it. It’s got to have the right humidity and the right temperature.
“The energy loads for painting a car are incredible! Paint was half of the total pie. So we knew we needed to focus our efforts on paint operations first.” The team installed additional meters to ascertain where in the paint area the most energy was consumed.
4. Set Goals for Action. Once Toyota made a company commitment to energy conservation, the resources were allocated so that constructive changes could be implemented. “The engineers and operations managers in the paint area said they had always been for energy conservation, but they weren’t free to spend their resources on those things until senior management said, ‘This is going to be a company priority. We are going to be energy-efficient. And we’re going to match the best that is out there.’”
Metering Drives Action
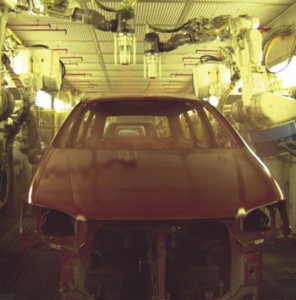
Figure 3:
Armed with the energy consumption data, the paint process area delayed its start-up time and reduced the time needed to balance the temperature and humidity levels to their optimum, from 61⁄2 hours to less than one hour. The reduction saved electricity and natural gas consumption significantly. Photo courtesy of TMMK, Georgetown, Ky.
Metering won’t save you a dime until you make decisions for changes based on that information, Rucker said. The company made energy-saving operational changes. Rucker and his team said that the metering allowed them to cost-justify important equipment and machinery purchases.
“Part of that shift from a peak demand of 120 MVA to 85 MVA is energy conservation,” Rucker said. “That reduction in energy used per car came from many sources, including lighting retrofits and purchasing energy-efficient process machinery.”
From 1996 until now, the plant reduced energy significantly (in MMBTU/vehicle):
1996: 11.32
2001: 8.89
2008: 5.81
2012: 6.28
- Condensed start-up time in Paint Dept. from 6 hours to 1 hour
- Eliminated compressed air blowoff
- Used meters for command and control
- Changed out process equipment
- Changed out facility HVAC, lighting
- Troubleshooting
- Assigning energy as raw material input
Condensed Paint Booth Start-up Time. Rucker cited a change in the paint area’s start-up process as an “early win.” (See Figure 3.)
“We looked at when our paint process lines were starting up Monday morning and found out that third shift would hit the ‘go’ button about midnight, but we didn’t start making cars until 6:30 a.m.,” Rucker said. “It takes time for a paint booth to balance out and for the air to achieve the correct quality numbers, but it doesn’t take 61⁄2 hours. What we didn’t know was how long it really did take.
“We had the data. Paint was the biggest user and had been given reduction targets.” So the energy management team worked with the paint personnel, starting the start-up process successively later until they found the sweet spot at 4:30 a.m. The next stage was to make that a standard operating procedure, track it, and hold the team members accountable for it.
Then the team scrutinized that startup window. “That gave us the chance to cycle back and ask, ‘Why does it have to take two hours? Why can’t it be an hour and a half, one hour?’ With better controls, better humidification techniques, filtration, and other things, we’ve reduced start-up time. We can go from zero to making cars in less than an hour.”
Eliminated Compressed Air Blowoff. The compressed air system had been designed to use a lot of blowoff to create steady pressure, which helped maintain quality, Rucker said. “When you make compressed air, if the machine starts to overpressurize the system, you would open a valve to keep pressure down. That’s a standard control model that is really effective because the machine is working at 100 percent all the time.
“Except we wasted a lot of air that literally was just going out the pipe.”
The team made several different attempts to change the process. It experimented with different types of blowoff valves, faster-acting devices, control algorithms, and upgraded controls. It took years of solid effort, but the team eliminated blowoff. “Today we only blow off in an emergency. Now it truly is a pressure relief, not a control scheme. That represents huge numbers,” Rucker said. Compressed air usage per vehicle dropped 14 percent from 2001 to 2012.
He added, “We couldn’t do that until we put the new compressor control system in because the old system wasn’t powerful enough.”
Used Meters for Command and Control. Rucker said his team uses the electric meters to inform them about when to use the HVAC system equipment or not. “We dispatch our chillers or stop them depending on how close we are to setting a new demand peak,” Rucker said.
“That’s probably the biggest peak shaver we have,” Holbrook added. “That and the air compressors.”
Rucker explained, “We’ve got 10 million gallons of chilled water storage in our chilled water systems. It’s like a giant battery for us. Like a hybrid car, sometimes we can run on the battery and sometimes we can run on the chillers or some combination.
“The guys built a chiller dispatch program that can sample the PowerLogic meters; look at weather data, load data coming from the shops, and planned load; and project ahead. It makes a decision on how many chillers to run at different times of the day. If needed, we can recharge that battery over the weekend or run it harder at night when energys rates are lower,” Rucker said.
“It works great. We use it on HVAC and the chillers, but also on process equipment like paint booths,” Holbrook said.
Installed Energy-efficient Stamping Press. The automaker bought a new servo-driven press based, in part, on energy consumption data and analysis. The press is a four-stage, fully automated 4,000 tonnage. The first stage has eight servos, the other three stages have four each.
More than 200 parts form the car body.
“This stamps our largest pieces,” Rucker said. “It’s big enough to stamp the entire side of the vehicle or the entire roof section—the whole piece. That’s part of the energy-saving design, because the larger pieces require less processing later. Fewer weld seams are needed, for example.” The result is less total energy consumed to form the part, he said.
“But it’s harder to stamp pieces that large, in part because of the wheel well, because that is a deep draw. Deep drawing is always a challenge, so we have to handle that carefully,” Rucker said.
A servo press can apply pressure differently than a standard flywheel press to form deep-draw operations. In addition, the servo press handles the difficult-to-press high-strength steel, which adds strength for enhanced safety but at a thinner gauge, which lightens the car for improved fuel efficiency.
The press is a 480-V rated machine. The load spike on the electrical system is double a standard flywheel press, so it requires dedicated substations, Rucker said. “It’s interesting; even though the press has a spike load, because the press doesn’t idle, its total energy use per stamped part is two-thirds of a standard flywheel press.
“And we know that because we metered it,” Rucker said.
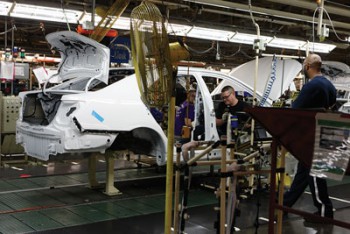
Figure 4:
Dingy, yellowish metal halide overhead lighting was replaced with brighter, more energy-efficient T8 task lighting, which is occupancy-sensored. About 10 percent of plant electricity usage had been for lighting; now it’s about 5 percent.
Retrofitted Lighting. Some of the individual task lighting and all of the overhead general lighting are now on individual occupancy sensors.
“Some of the savings are a result of simply turning the lights off at lunch and turning things off during the weekend that don’t need to be running.”
The plant originally was fitted with standard metal halide and sodium vapor fixtures. “The lighting was real yellow. We replaced the metal halide with ceramic metal halide, which brightened it up some, and then we swapped it for the fluorescent lighting.” (See Figure 4.)
Production task lighting fixtures are now 2, 26-W T-8 fluorescent lamps. “We spent a lot of time researching the best bulb and ballast combination. A couple of different bulbs could do it but we use a GE electronic ballast that drives the bulb to a lower wattage than rated. The bulbs are rated 32 W. We drive them at 26 W to get the right output,” Rucker said.
Task lighting is engineered for each task. “The team members have control of it. It might be tied to the automation on the line, or an on-off switch, a motion sensor … whatever makes sense to them,” Rucker said.
“The team members love the new lighting because the color is better and the light is brighter,” he added. The company loves the resulting cost savings as well.
“About 10 percent of our plant electricity usage used to be lighting. Now it’s about 5 percent.”

Figure 5:
Compressed air is used throughout the plants for a multitude of purposes, including to power hand tools such as drills. New air compressors are 22 percent more energy-efficient.
Purchased Energy-efficient Air Compressors. After evaluating the metering data, the company bought new air compressors that are 22 percent more energy efficient than those they replaced (see Figure 5).
“We had a worn-out air compressor. The metering helped justify the cost for the replacement instead of trying to rebuild it,” Holbrook said. “We were able to say, ‘This air compressor still has some life left, but it’s costing us this much per unit in energy. If we get a new one in, it would cost this much less per unit, and the delta pays for the earlier replacement.’”
Upgraded Air Compressor Controls. The facilities group is responsible for producing compressed air for the other buildings. “So the efficiency of that is our responsibility, as well as the auxiliary loads—such as water pumps and coolers—which means changing pumps from different types of controls and drives to another, maybe variable-speed drives.
“We invested a lot of money changing out our air compressor control system to sequence the compressors better. We run the most efficient air compressor at any point, kind of like utility generating dispatch stations.”
Referenced for Troubleshooting. The useful aspect of metering, particularly for the electrical systems, is for troubleshooting, Rucker said. “We can see if we’re running our equipment efficiently or if there’s something wrong with it. For example, we have the power quality meters on our main incoming from the utility. When we get a flicker from the utility, I can tell right away whether it was
an external flicker, as opposed to a flicker from a piece of equipment.”
Assigned Energy as Raw Material Input. “One of the other things that we do, because now we have that kind of granularity with our electric and mechanical metering, is to backcharge our shops,” Rucker said. The shops are each held budget-responsible for their energy consumption, just like any other material input.
Every shop—the Stamping, Body Weld 1 and 2, Paint 1 and 2, Assembly 1 and 2, Plastics, Powertrain, and Axle—receives a monthly report of its energy use. That information is referenced in forming their energy reduction plans. “We isolate each department in each building so they’ll know exactly what they use.
“Before, we couldn’t build that detail per building or per department. Now we can set goals for each individual area, so they can see what they need to work on to relieve the burden or to cut costs.”
The bus ducts break down by line equipment. In assembly, the engine line, trim line, and chassis line are on their own separate bus ducts because it’s such a big place, and each of those bus ducts is metered.
“We can tell with a fair degree of accuracy how much it costs to mount, wire in, and pipe in the engine to the car chassis. And I can go to the engine plant and tell with a fair degree of accuracy how much it took to assemble and test the engine versus machining the engine. So we’re able to break it down, to a fairly tight level, accurately,” Rucker said.
Armed with the data, the shops have to form a strategy to meet their energy-use goals. “Then they start hacking through it, looking for the information that’s hidden in the data. That’s when they start to run reports, and look for the waste. They have to figure out which kaizens they are going to put in place, which means they have to put them in their budgets, staff it, and do it.”
In some areas individual machines, such as stamping presses, can be metered, Rucker said. “They can tell how much each press is consuming. Using ActivPlant, they can tie into production output and say, ‘This is how much it costs to make the hood. This is how much it costs to make the sides.’ They can give you an energy bill per part and nail it. It’s a solid number.”
Other areas, such as powertrain, have their lines on different bus ducts. “They tend to share air trees, so it’s harder for them to split out compressed air. But generally, their electricity comes from one source point that we meter.”
Curtailed Usage. It is fairly typical for industrial plants to be charged extra during peak demand. Because the plant’s operation is a continuous process, it cannot alter its production activities to engage in peak shaving when it is approaching a peak, in contrast to some industrial plants that can, and are paid for it (demand response), Rucker said.
“This year we’re making a record number of cars and working as much overtime as we can right now, so any car we don’t make is a car we don’t sell. We’re not going to threaten production with peak shaving, but there are some things we can do on the facilities side, such as our chiller dispatch.”
Negotiated Utility Contracts. Holbrook said that knowing how your usage is trending is a major advantage in negotiating contracts with utilities. “The gas company wants to sell you this big buffer that you pay for, for that peak day when you might need to use more gas. So knowing what you use gives you that negotiating power to say, ‘We just need this.’ That comes from
metering.”
Stretch Goals
Rucker said that the data collected can then be used to set some benchmark targets.
“Now we can ask, ‘Why is Plant X somewhere else in the world painting a car for half of the energy that we do? What are they doing differently, better, cheaper?’
“So what does that mean? You’ve got your current situation. You’ve got your ideal. Then you’ve got a gap. So you start setting your goals and put a plan in place to close the gap.
“That is the classic TPS thought process that you apply to the energy piece. You just attack your energy as an input to the process and you try to minimize that input.”
*The adage is attributed to either Peter Drucker or J. Edward Demming.
Except where noted, photography by Bryan Moberly for Green Manufacturer.
Side by side, we move metal fabrication forward.
FMA unites thousands of metal fabrication and manufacturing professionals around a common purpose: to shape the future of our industry, and in turn shape the world.
Learn More About FMA